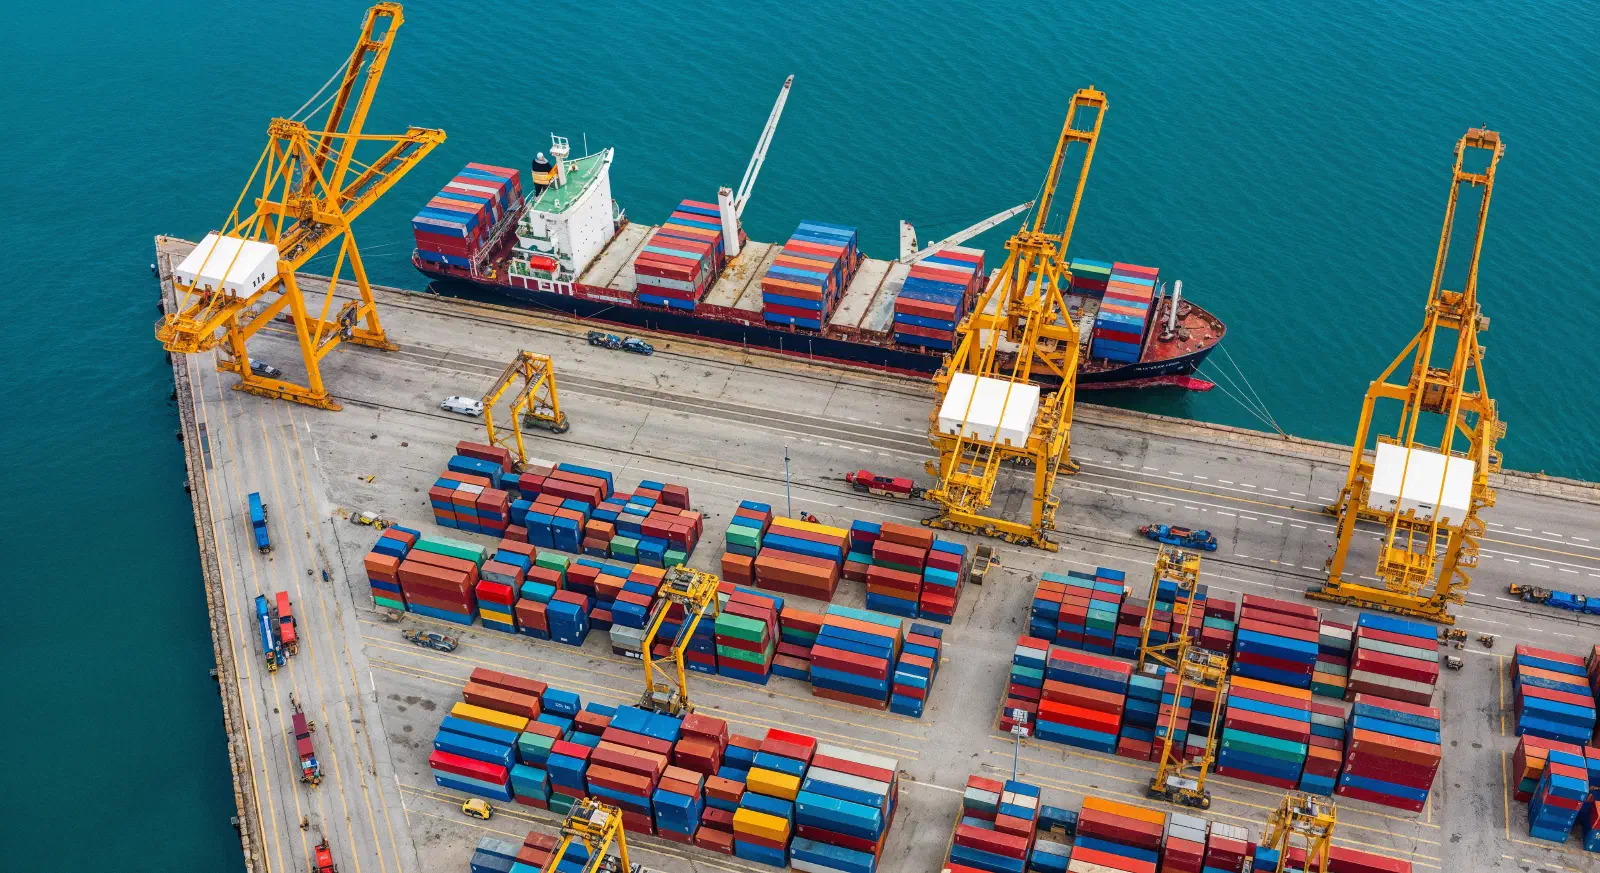
Shippers who have been waiting for the post-typhoon port congestion in Asia to clear before making Q4 freight decisions need to hear this clearly: it is not clearing. Container congestion in Asia is now expected to persist into 2027, according to analysis published this week. Citing data from Sea-Intelligence, industry analysts confirmed that 8.5 percent of the global container ship fleet is currently tied up in congestion-related delays. That is equivalent to roughly 3 million TEUs of capacity effectively removed from the market, more than the total capacity of all but four of the world’s largest carriers. The congestion is not a short-term disruption that will resolve before peak season ends. It has become the operating environment that Q4 freight will run through.
How we got here
The congestion story of 2026 did not begin with a single event. It began with a freight market already under structural strain from the Strait of Hormuz closure in February, which rerouted vessels and absorbed effective capacity across the global network. That strain was compounded by Typhoon Dolphin in early August, which closed Shanghai and Ningbo for several days and stranded more than 2.4 million TEUs. Before that backlog cleared, Typhoon Saudel hit the same ports again in late August, sending berthing delays to 10 days at the two busiest container ports in the world.
The cascade from those two typhoons has not worked through the system. Vessels that were delayed in August and early September have been arriving in irregular bunches rather than on schedule, creating congestion at transshipment hubs that extends the delays beyond the ports that were originally affected. Colombo, for example, has absorbed elevated transshipment volumes as India to US trade routes have been disrupted, creating its own bottlenecks that feed back into the broader network.
The Golden Week holiday in China from October 1 through 7 reduced factory output and port throughput during a week when the network was already trying to clear backed-up cargo. The post-Golden Week volume that typically surges in mid-October will arrive into a congested network rather than a recovered one.
What 8.5 percent of the fleet means in practice
The 8.5 percent figure deserves specific attention because it translates directly into what shippers experience as unreliable schedules, rolled cargo, and extended transit times.
When 8.5 percent of the global fleet is tied up in congestion-related delays, those vessels are not on the routes they were scheduled to serve. Their capacity is not available for the sailings that shippers have booked. Carriers respond by deploying substitute vessels where they can, skipping port calls at congested terminals, or rolling cargo to the next available sailing.
The result is the schedule reliability environment that Sea-Intelligence confirmed in its July report at 56.4 percent, the lowest level recorded since February 2025. August and September data, when published, are expected to be worse given the Typhoon Saudel disruption that occurred after July’s reading was compiled.
For shippers, schedule reliability at these levels means the transit time printed on a booking confirmation is closer to a best-case estimate than a planning input. Freight that was supposed to arrive in week one of November may arrive in week two or three. Delivery commitments made to retail partners or distribution centers based on standard transit assumptions are being routinely missed across the industry.
Why congestion is expected to persist into 2027
The expectation that congestion will persist into 2027 reflects the scale and interconnectedness of the disruptions rather than pessimism about any single factor.
The fundamental issue is that congestion at one point in the global network creates knock-on effects at every other point the delayed vessels subsequently call. A vessel that leaves Shanghai a week late arrives at its transshipment hub a week late, missing its connecting service, which means the cargo it carries misses its next leg. That cargo either waits for the next available connection or is rerouted through an alternative hub, both of which add further delay and strain alternative capacity.
When this pattern plays out across thousands of vessels simultaneously, the ripple effects extend well beyond the original disruption point. The typhoon disruptions of August and September created cascades that are now being felt at ports in Southeast Asia, South Asia, and the Middle East that had no direct exposure to the typhoons themselves.
Drewry’s intra-Asia container index has climbed to record territory in the wake of the congestion, with individual trade lanes setting historic highs. Rates on specific intra-Asia lanes have risen sharply as the congestion creates regional capacity shortfalls on top of the global effective capacity reduction.
What this means for Q4 freight planning right now
The congestion environment shaping Q4 is not something shippers can route around entirely. But there are specific actions that reduce exposure to its worst effects.
Build two to three weeks of additional buffer into all China-origin Q4 delivery commitments that have not yet been made to customers.
Transit time assumptions based on pre-disruption schedules are systematically understating actual delivery risk in the current environment. Commitments made on those assumptions will be missed at a rate that has nothing to do with shipper performance and everything to do with the congested network the freight is travelling through.
Verify the current status of any Q4 bookings that were made before September.
Vessels that were on schedule when those bookings were confirmed may have accumulated significant delays since. Knowing where your freight actually is, rather than where it was expected to be, is the starting point for managing Q4 delivery risk.
Evaluate whether any remaining Q4 ocean freight volume qualifies for intermodal routing.
The West Coast plus intermodal routing through the Panama Canal alternative avoids some of the most congested transshipment hubs on the Asia to East Coast routing. For volume with transit time flexibility, West Coast entry plus inland intermodal can provide more routing certainty in a congested network environment than East Coast routing via contested transshipment hubs.
Have a plan for air freight on your highest-risk Q4 inventory.
For products with hard November and early December delivery deadlines where ocean freight buffer is running out, knowing your air freight options before the decision is forced is better than discovering them under deadline pressure. Air cargo capacity from Asia remains elevated but the post-Golden Week surge in October will tighten spot availability. Understanding what air costs for your highest-risk inventory now gives you a realistic view of your true Q4 delivery option set.
At HighQ Logistics, we track vessel positions and schedule performance across all major trade lanes so that our shippers know the realistic delivery picture for their freight rather than the optimistic one. If you have Q4 ocean freight in the system and want a current view of where things actually stand, talk to the HighQ team or get a freight quote.
Container congestion in Asia is expected to persist into 2027, with 8.5 percent of the global fleet currently tied up in delays. The cascading effects of back-to-back typhoons, Golden Week, and the structural strain of sustained routing disruptions have created a congestion environment that will not resolve before Q4 holiday freight needs to be on shelves. Shippers who build adequate transit buffer, verify current vessel positions, have air freight options identified for high-risk inventory, and work with logistics partners who monitor the actual delivery picture rather than the scheduled one will navigate Q4 better than those who are still planning around pre-disruption transit time assumptions.
Frequently Asked Questions
How bad is container congestion in Asia right now?
Container congestion in Asia is expected to persist into 2027, with 8.5 percent of the global container fleet currently tied up in congestion-related delays as of early October 2026. That is equivalent to roughly 3 million TEUs of capacity effectively removed from the market, more than the total capacity of all but four of the world’s largest carriers.
What caused the current level of Asia port congestion?
The congestion reflects cascading disruptions rather than a single event. The Strait of Hormuz closure since February absorbed global effective capacity through longer rerouting. Typhoon Dolphin in August stranded more than 2.4 million TEUs at Shanghai and Ningbo. Typhoon Saudel hit the same ports before the Dolphin backlog cleared, pushing berthing delays to 10 days. The cascades from those disruptions have spread to transshipment hubs across Southeast Asia and South Asia that had no direct typhoon exposure.
Why is congestion expected to last into 2027?
When vessels depart major ports on irregular schedules due to congestion, they arrive at their transshipment connections late, miss connecting services, and require reroutings that strain alternative hubs. This cascade pattern creates congestion at ports well downstream from the original disruption. The scale of simultaneous disruptions in 2026 has created ripple effects across the global network that will take longer to dissipate than a single discrete event would.
What does the congestion mean for container freight rates?
Drewry’s intra-Asia container index has climbed to record territory as regional capacity shortfalls compound the global effective capacity reduction from the congestion. For Asia to US Transpacific trades, effective capacity remains constrained both by the congestion tying up vessels and by Panama Canal slot restrictions. Rates remain elevated and the congestion environment removes one of the typical reasons for seasonal rate softening in Q4.
How does the Golden Week holiday affect the congestion situation?
China’s Golden Week holiday from October 1 through 7 reduced factory output and port throughput during a week when the network was already trying to clear backed-up cargo. The post-Golden Week volume surge typically arrives in mid-October and will land into a congested network rather than a recovered one, adding a seasonal demand layer on top of existing structural congestion.
Should shippers use air freight for Q4 inventory because of the congestion?
For inventory with hard November and early December delivery deadlines where ocean freight transit buffer has run out, air freight is worth evaluating. Air cargo capacity from Asia remains available but the post-Golden Week surge in October will tighten spot availability. Understanding air freight costs for your highest-risk Q4 inventory now provides realistic options before deadline pressure forces the decision under worse conditions.
What transit time buffer should shippers build into Q4 China-origin delivery commitments?
A minimum of two to three weeks of additional buffer beyond standard transit time assumptions is appropriate for Q4 China-origin ocean freight given the current congestion environment. Schedule reliability in July was 56.4 percent, the lowest level recorded since February 2025, and August and September data is expected to be worse. Commitments made on standard transit time assumptions are being systematically missed across the industry.